Know Every Visitor. Instantly.
A self-hosted, server-side analytics platform that reveals who is on your website in real time — their identity, behavior, GPS location, device, intent, and lead score — with zero monthly fees.
 Replace with your screenshot
What is NeonStat?
NeonStat Visitor Intelligence is a powerful, lightweight analytics system you install on your own server. Unlike cloud-based platforms that slow your site and charge monthly, NeonStat runs entirely on your infrastructure — giving you complete control over your data with no third-party dependencies.
Every visitor who lands on your website is captured in real time. NeonStat records their IP, GPS coordinates, device, pages visited, time on site, referral source, lead score, and user type — and presents it all in a sleek, dark-themed command center that refreshes live.
What sets NeonStat apart is its intelligence layer — an automated engine that classifies every visitor as Human, Suspicious, or Bot, scores their engagement level from COLD to PRO, tracks their geographic origin down to the city level, and now shows real GPS coordinates for visitors who share location.

System Requirements
NeonStat runs on any standard PHP hosting environment. No Node.js, no npm, no complex setup.
| Requirement | Minimum | Recommended | Notes |
|---|---|---|---|
| PHP Version | 7.4+ | 8.1+ | cURL extension required |
| Web Server | Apache / Nginx | Apache with .htaccess | mod_rewrite optional |
| Disk Space | 5 MB | 50 MB+ | Grows with traffic logs |
| File Permissions | 755 folders | 755 / 644 | visitors/ must be writable |
| Internet Access | Required | Required | For license activation & GeoIP |
| Browser (Visitor) | Any modern browser | Chrome / Firefox latest | For GPS permission prompt |
| Browser (Admin) | Chrome 90+ | Chrome / Firefox latest | JavaScript enabled |
NeonStat works on all major hosting providers including Dreamhost, SiteGround, Hostinger, cPanel-based hosts, and VPS servers. No special server configuration is required.
Quick Installation
Get NeonStat running on your website in under 5 minutes. Upload, configure your tracker, and you are live.
Upload Files
Extract neonstat.zip and upload the entire folder
to your server root or any subdirectory via FTP or cPanel File Manager.
Add Tracker Script
Place the tracking script in your website's header or footer using
the <script defer src="/neonstat/tracker.js"></script>
tag. Copy the one-line embed code from your installation folder.
Open Dashboard
Navigate to yoursite.com/neonstat/index.php in your
browser. The first-run activation screen will appear.
Activate License
Enter your NEON-XXX-XXXXXX-XXXXX license key, create
your admin password, set your master recovery key, and activate.
Start Tracking
Your dashboard is live. Visit any page on your website — you will see yourself appear in the live visitor feed within seconds.
Important: The visitors/ folder is auto-created on first run. Ensure your server allows PHP to create directories with write permissions (755).
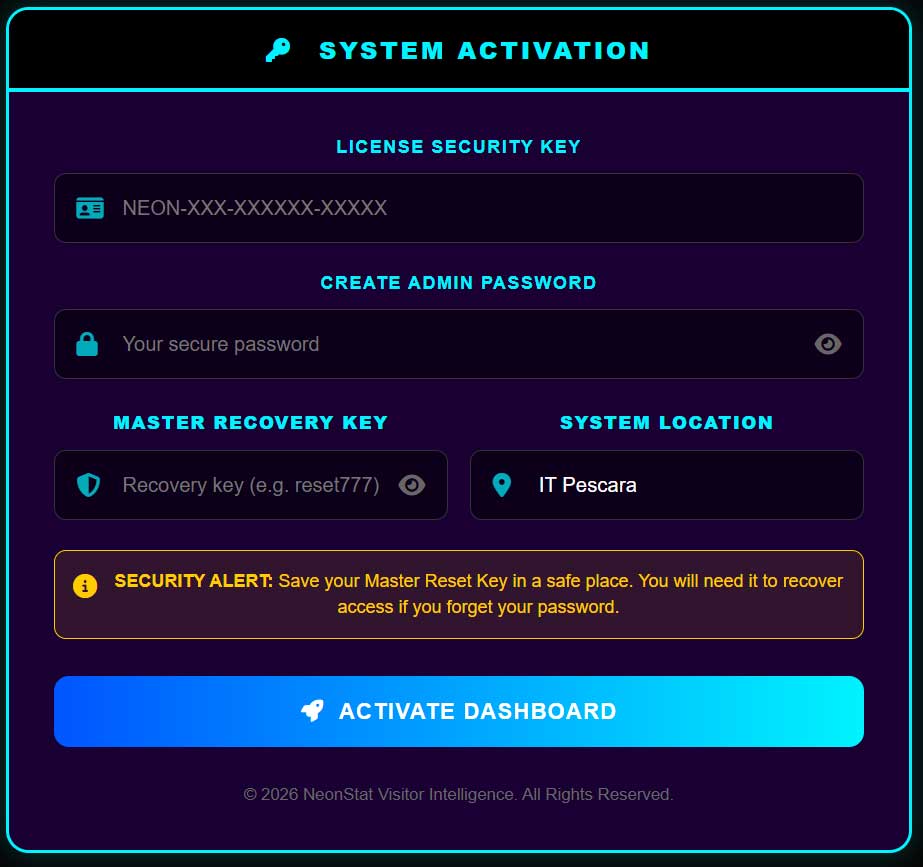
License Activation
First-run activation takes under a minute. Your license is validated against the NeonStat server and locked to your domain.
| Field | Description |
|---|---|
| License Key | Your unique key in format NEON-XXX-XXXXXX-XXXXX. Copy it exactly — do not type manually. |
| Admin Password | Your dashboard login password. Minimum 4 characters. Can be changed at any time from the admin panel. |
| Master Recovery Key | Emergency backup key to reset your password if locked out. Write this down and keep it safe. It cannot be recovered if lost. |
| System Location | Auto-detected from your server IP. Used for timezone and geography calibration. |
Security Alert: Save your Master Recovery Key in a secure location before activating. You will need it to recover dashboard access if you forget your password. It cannot be retrieved from the server.
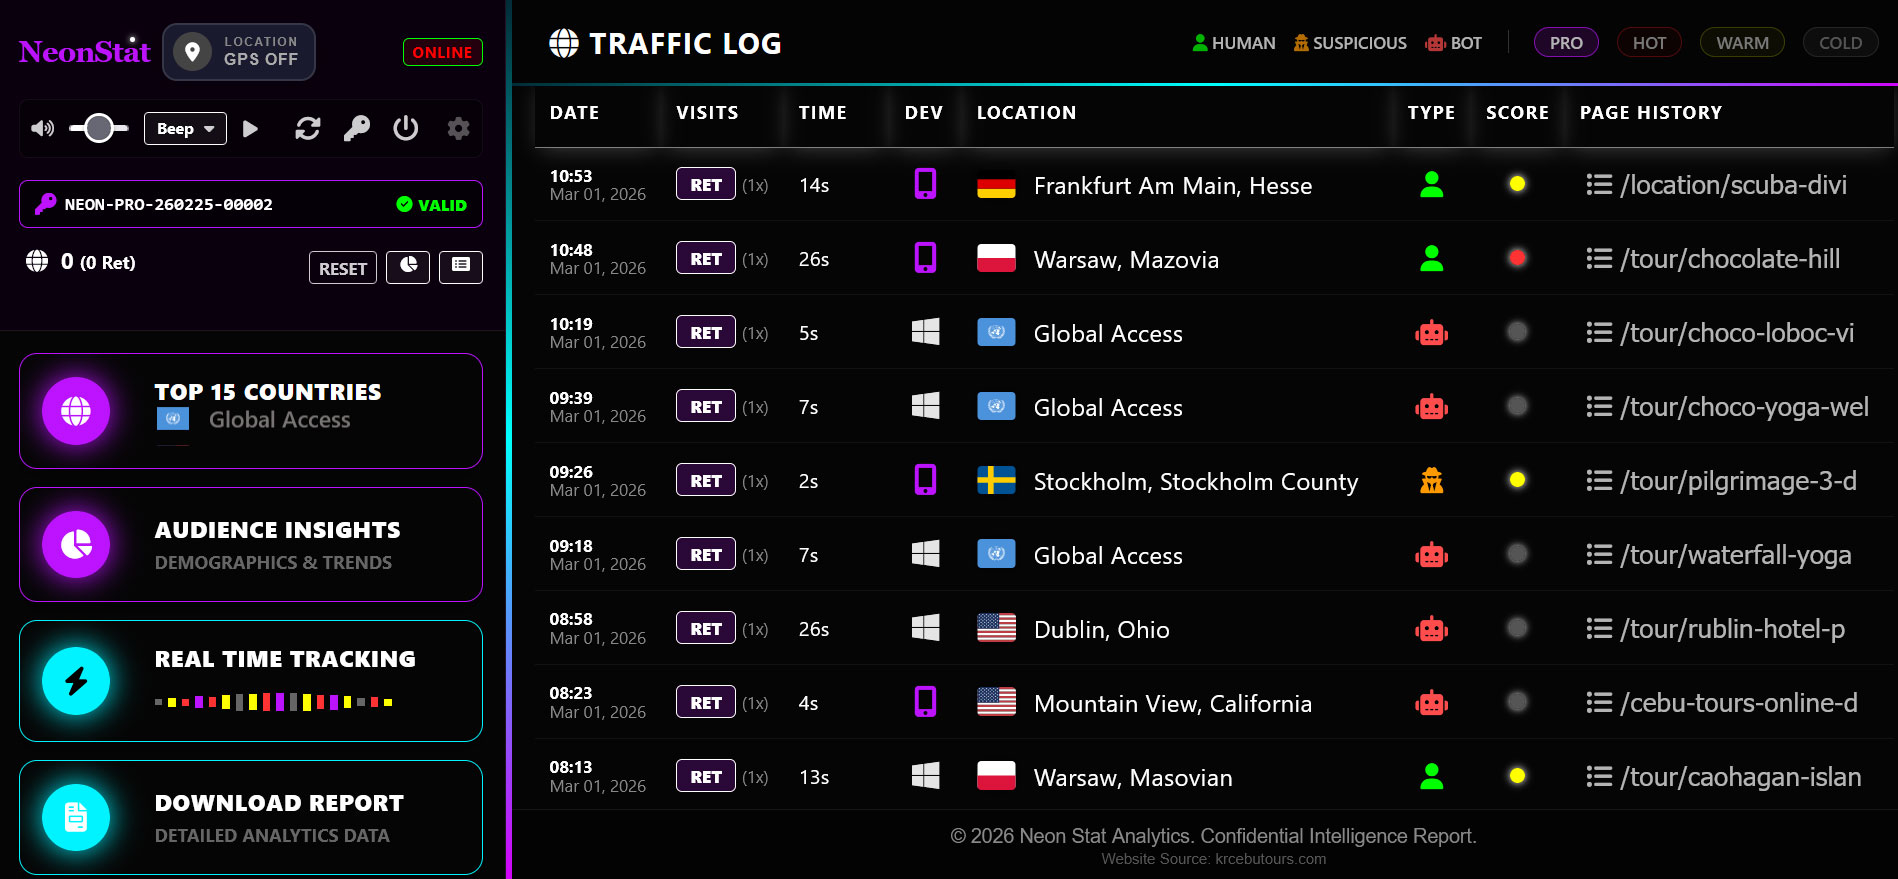
Real-Time Tracking
See every visitor the moment they land. The live feed updates automatically — no manual refresh required.
Live Session Timer
Every active visitor shows a live time-on-site counter that updates in real time, showing exact seconds spent on your website.
Real-TimePage Journey Tracking
See every page a visitor browses during their session with clickable links, visit counts per page, and navigation flow.
Behavior5-Minute Auto Archive
Sessions inactive for 5 minutes are automatically archived to history with their final duration recorded — never losing a data point.
AutomationButton Click Recording
Tracks button click events during live sessions, giving you insight into which calls-to-action are engaging your visitors.
EventsReturning Visitor Detection
Cross-references active sessions with IP history to instantly identify returning visitors and display their visit count.
IdentityLive Country Flags
Every visitor row displays a real country flag with full location name, resolved in real time from their IP address.
GeographyLive Candlestick Chart
A real-time ApexCharts candlestick visualization built from authentic OHLC visitor data — Open, High, Low, Close visitor counts sampled live every 5 minutes. No simulated data, ever.

The candlestick chart samples real visitor counts at the start and end of each 5-minute window to build genuine OHLC values. Every candle represents authentic traffic — upward candles (green) show growing sessions, downward (red) show sessions dropping off.
Verified Authentic Data: Live, Idle, Loading, and Offline counts are calculated in real time from actual session files — not estimated or simulated. Each candle tooltip shows the true breakdown of visitor states during that window.
Tooltip Status Breakdown
Visitor Intelligence
Click any visitor row to open a deep-dive intelligence panel — a complete profile of that person's session, behavior, and identity signals.
The Visitor Intelligence drawer reveals everything captured about a session — from the exact device and browser to the full page history with visit counts, total session duration, lead score, IP address, geographic location down to the city level, and GPS coordinates if shared.
The intelligence panel works for both live sessions and archived history — click any row in either the live feed or traffic log to open the full profile.
Lead Scoring Engine
Every visitor is automatically scored based on their time on site and pages visited. Know instantly who is just browsing and who is ready to buy.
The scoring engine runs automatically on every session. It combines session duration and page depth into a single score that maps to four intelligence tiers — each represented by a colored dot in the live table and a badge in the statistics panel.
score = duration_seconds + (page_count × 10)
// PRO threshold: customer purchase behavior detected
// Bots are always scored 0 regardless of session length
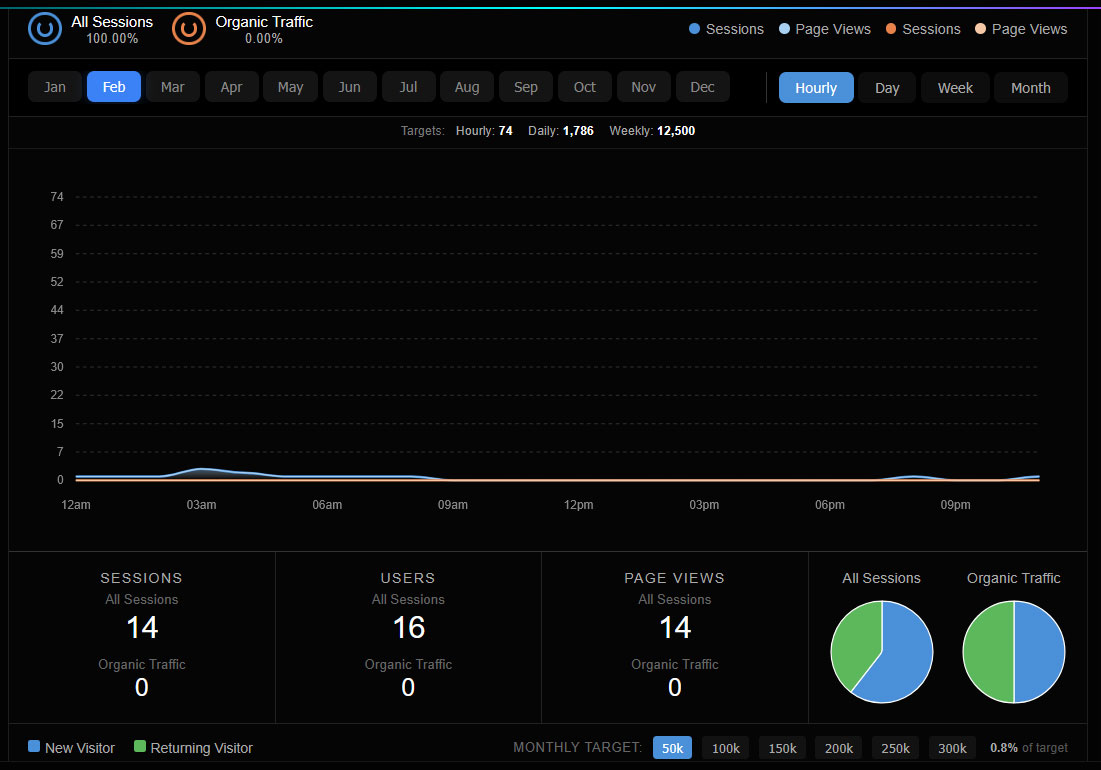
Audience Overview
A Google Analytics-inspired dashboard with a real-time area chart showing Users, New Users, and Sessions over the selected time range — with key metrics at a glance.
Updated in v1.0: The Audience Overview now mirrors Google Analytics layout — a multi-series area chart on top, summary metric tiles below, and all data pulled from real session history. Data is 100% authentic from your visitor files.
Time Range Filters
Filter all metrics by 7 days, 15 days, 30 days, 2 months, or 3 months with a single click. All charts update instantly.
AnalyticsMulti-Series Area Chart
Three overlapping color-coded area series — Total Users (purple), New Users (cyan), Sessions (green) — rendered with smooth ApexCharts curves.
VisualizationKey Metric Tiles
Summary cards showing Total Users, New Users, Sessions, Avg Session Duration, Bounce Rate, and Pages per Session — all live calculated.
MetricsDevice Breakdown
See the exact split between Desktop, Mobile, and Tablet visitors with radial donut segments in real proportional colors.
DevicesTraffic Source Analysis
Tracks Direct, Organic Search, Social Media, and Referral traffic separately so you know which channels drive real results.
SourcesHourly Activity Chart
Visualize traffic by hour across the day to identify your peak engagement windows and schedule content accordingly.
PatternsHow to use the Monthly Target selector: The Monthly Target buttons (50k, 100k, 150k, 200k, 250k, 300k) are located at the bottom of the Audience Overview panel. Here is the correct two-step process:
- Step 1 — Click your desired monthly target number at the bottom (e.g. 200k). This sets the target and updates the Hourly / Daily / Weekly breakdown numbers.
- Step 2 — Click a month button at the top of the chart (e.g. Feb) to refresh the chart. The Y-axis will now scale to your selected target.
Important: The chart does not update automatically when you click a target button alone. You must click a month button afterwards to apply the new scale to the chart.
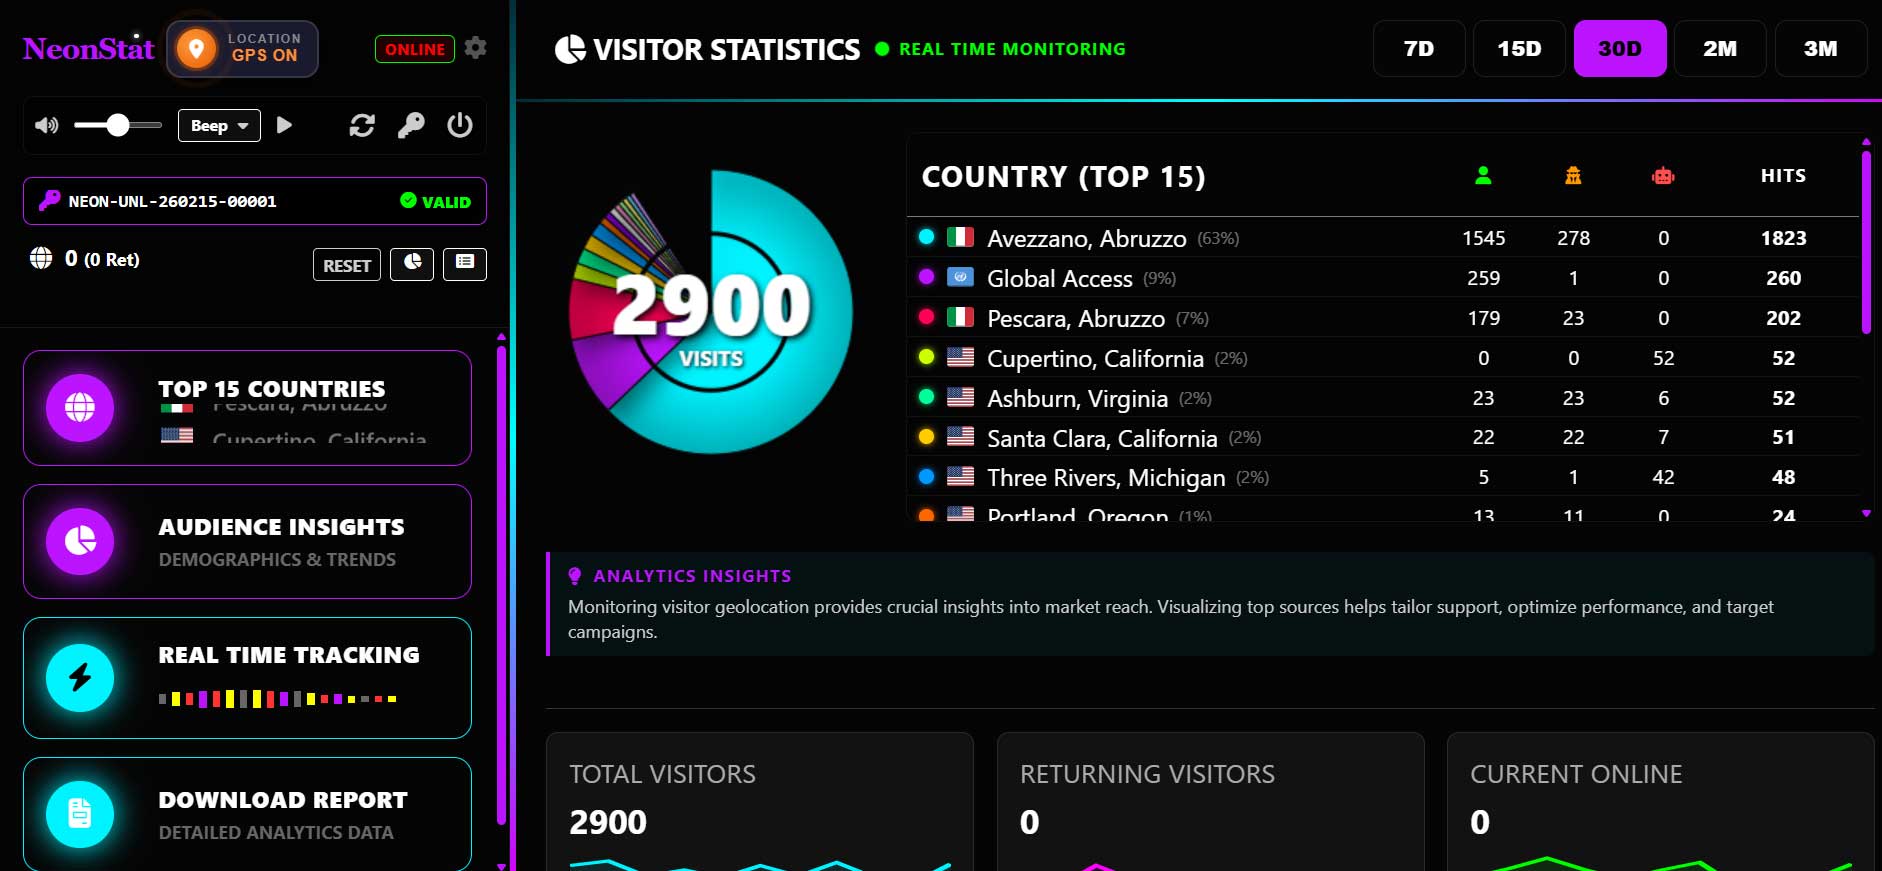
Geography Engine
A precision location engine that maps 200+ countries, cities, and regions. Every visitor is resolved to their exact geographic origin and categorized as Local, National, or International.

The Geography Engine combines GeoIP database lookups with a comprehensive built-in location map covering 200+ countries and major cities. Visitor locations are displayed with real country flags, city names, and region data in the live table.
| Classification | Description |
|---|---|
| LOCAL | Visitors from your configured home country |
| NATIONAL | Visitors from your broader national region |
| INTERNATIONAL | Visitors from all other countries worldwide |
The Top 15 Countries sidebar widget shows a live scrolling ticker of the most active countries, updated in real time as visitors arrive.
GPS Location Tracking
NeonStat can capture precise GPS coordinates from your website visitors using the browser's native Geolocation API — providing exact lat/lon coordinates for any visitor who grants permission.
Updated in v1.0: GPS tracking is no longer limited to the admin device only. GPS coordinates are now requested from all visitors via tracker.js — giving you device-precise locations for your entire audience, not just yourself.
Admin Option: Enable or Disable GPS for All Visitors
GPS tracking is powerful but optional. You can turn it on or off at any time by editing a single line in tracker.js:
// ON — requests GPS from all visitors (default):
var enableGPS = true;
// OFF — disables GPS entirely, no browser prompt shown:
var enableGPS = false;
Setting enableGPS = false completely suppresses the browser location prompt. NeonStat will fall back to IP-based geolocation for all visitors instead.
| Pros of GPS ON | Cons of GPS ON |
|---|---|
| Device-precise coordinates — accuracy within 5–20 meters vs. IP geolocation which can be off by entire cities | Browser shows a permission popup — some visitors immediately leave or feel surveilled when they see a location request |
| Exact city, street-level heatmaps for understanding where your real audience physically is | Can increase bounce rate — privacy-conscious visitors on mobile especially will deny and leave |
| Useful for local businesses, events, or geo-targeted services where knowing exact visitor location adds real value | GDPR / privacy law obligation — you must disclose GPS collection in your privacy policy and in some regions obtain explicit consent before requesting it |
| Coordinates refresh every 30 seconds if the visitor stays on the page — you see movement in real time | Requires HTTPS — browsers block geolocation on HTTP entirely. Will silently fail on non-SSL sites |
| Falls back to IP geolocation gracefully if permission is denied — you still get approximate location | If your audience is mostly desktop users on corporate networks, GPS is rarely granted anyway — limited benefit |
When a visitor lands on your website, the browser may prompt them to share their location. If granted, the exact coordinates are captured with accuracy readings in meters and stored with their session. The GPS data is visible in the live visitor table and in the Visitor Intelligence drawer.
| Data Point | Details |
|---|---|
| Latitude / Longitude | Precise device coordinates in decimal degrees |
| Accuracy | Margin of error in meters (typically 10–50m) |
| Refresh Rate | Updated every 30 seconds if visitor stays on page |
| Permission | Browser prompts visitor; data only stored if granted |
| Fallback | If GPS denied, IP geolocation is used automatically |

Privacy Note: GPS tracking requests explicit browser permission from each visitor. Visitors can deny the request without consequence. Include GPS data collection in your privacy policy / cookie notice as required by GDPR.
GPS works on HTTPS sites only. Browsers block geolocation on HTTP connections. Ensure your site has an SSL certificate installed.
Security System
NeonStat includes a multi-layer security architecture — from visitor classification to admin protection, CSRF defense, IP banning, and remote license kill-switch.
Bot Detection
Automatic identification of crawlers, spiders, scrapers, and headless browsers using a comprehensive user-agent signature database covering 30+ bot types.
ProtectionSuspicious Visitor Flag
Visitors with session durations under 5 seconds are automatically flagged as Suspicious — identifying potential scrapers or fake traffic that passed bot detection.
IntelligenceIP Ban System
Ban any visitor's IP address directly from the dashboard with one click. Banned IPs are blocked from further tracking and their live sessions are immediately removed.
ControlCSRF Protection
Every admin form submission is validated with a rotating cryptographic CSRF token, preventing cross-site request forgery attacks on your dashboard.
SecurityRemote Kill-Switch
The license server can revoke access remotely. On revocation, the next admin session check automatically logs out and blocks all access with a clear security message.
LicenseMaster Recovery Key
A backup passphrase set during activation that can reset your admin password if locked out — stored locally on your server, never transmitted to NeonStat.
RecoveryAnalytics Reports
Generate and save professional analytics reports directly from the dashboard as self-contained HTML files, ready to share with clients or stakeholders.

The Download Report section generates a complete Website Visitor Analytics Report including the Monthly Visits Overview, data authenticity statement, and business intelligence narrative — all in a single exportable HTML file.
| Report Section | Contents |
|---|---|
| Monthly Overview | 12-month chart of total, new, and returning visitors |
| Data Authenticity | Technical explanation of collection methodology |
| Business Intelligence | Strategic analysis of traffic patterns and ROI |
| Export Format | Self-contained HTML file, saved to /archives/ |
Reports are saved automatically to the archives/ folder on your server with timestamped filenames for easy retrieval.
Sound Alert System
Get notified the moment a new visitor arrives with customizable audio alerts. Choose from 12 different notification sounds and control the volume directly from the sidebar.
12 Alert Tones
Choose from Beep, Digital, Chime, Crystal, Pop, Correct, Arcade, Magic, Phone, Bell, Horn, or Boing — each with a preview button.
AudioVolume Control
Inline volume slider in the sidebar lets you set alert volume from silent to full — persisted across sessions using localStorage.
ControlNew Visitor Trigger
Plays automatically every time a new session registers in the live feed — so you never miss a visitor even when working in another tab.
NotificationsDashboard Customization
Personalize your NeonStat dashboard with custom colors, header text, fonts, and footer branding — white-label ready for agency use.
| Setting | Description |
|---|---|
| Header Text | Replace "NeonStat" with your brand name or client name |
| Header Color | Custom hex color for the dashboard title |
| Header Font | Choose from system font families for the brand display |
| Primary Color | Controls the neon accent color used throughout the UI |
| Panel Background | Custom background color for the main dashboard areas |
| Footer Text | Custom copyright text shown at the bottom of every view |
All theme settings are saved to visitors/theme_settings.json and applied on every page load. Changes take effect immediately without any server restart.

Configuration & Settings
NeonStat stores all configuration in simple text files — no database required. Settings are automatically detected on first run.
timezone=Europe/Rome
masterkey=your_recovery_key
Never delete the visitors/ folder or its contents while the tracker is active. Doing so will erase all history and require re-activation.
⚠ Important: history_log.txt Performance Limit
NeonStat stores all completed visitor sessions in a single flat file: visitors/history_log.txt. This file is read entirely into memory on every dashboard page load. As your traffic grows, this file grows with it.
Estimated file size and performance impact by visitor volume:
| Monthly Visitors | Est. File Size | Performance | Action Required |
|---|---|---|---|
| Up to 50,000 | ~15 MB | ✓ Fast | None needed |
| 50,000 – 150,000 | 15 – 45 MB | ⚡ Moderate | Archive monthly |
| 150,000 – 300,000 | 45 – 90 MB | ⚠ Slow | Archive monthly — required |
| 300,000+ | 90 MB+ | ✗ Very Slow | Archive monthly + consider SSD hosting |
The Audience Overview reads from archived files separately, so your historical analytics remain intact after archiving. Only the active history_log.txt is kept lean.
Archiving moves the current month's data into a dated archive file and starts a fresh history_log.txt. Your Audience Overview will continue reading all archived months automatically.
# Step 2 — Navigate to your NeonStat folder:
public_html/neonstat/visitors/
# Step 3 — Download a backup copy of history_log.txt to your computer
# Step 4 — Rename history_log.txt to the archive format:
# history_log_YYYY_MM.txt (example: history_log_2026_01.txt)
# Step 5 — Create a new empty file named history_log.txt
# Leave it completely empty — NeonStat will populate it automatically
# Done. The Audience Overview reads all history_log_*.txt files automatically.
cd /var/www/html/neonstat/visitors
# Archive current log with today's year-month stamp:
cp history_log.txt history_log_$(date +%Y_%m).txt
# Clear the active log (do NOT delete it):
truncate -s 0 history_log.txt
# Verify archive was created:
ls -lh history_log*.txt
# Set schedule: 0 0 1 * * (runs at midnight on the 1st of every month)
# Command to paste (update path to match your server):
cp /home/yourusername/public_html/neonstat/visitors/history_log.txt \
/home/yourusername/public_html/neonstat/visitors/history_log_$(date +\%Y_\%m).txt \
&& truncate -s 0 /home/yourusername/public_html/neonstat/visitors/history_log.txt
# Replace "yourusername" with your actual cPanel username.
# This runs automatically — you never need to think about it again.
Recommended schedule: Archive on the 1st of every month. If you are targeting 300,000+ monthly visitors, also consider upgrading to a VPS or SSD-based hosting plan for optimal dashboard load times. Shared hosting with spinning disk drives will struggle above 150,000 entries regardless of archiving.
File Structure
Complete map of every file in your NeonStat installation and what each one does.
The .htaccess file in the visitors/ folder blocks direct browser access to all data files. Never remove it.
License Plans
All NeonStat licenses are lifetime — pay once and install on as many websites as your plan allows. No monthly fees, no renewals, no subscriptions.
- Full real-time dashboard
- All analytics features
- GPS visitor tracking
- Candlestick live chart
- Audience Overview
- Email support
- FREE Popup Generator
- 1 domain installs
- Full real-time dashboard
- All analytics features
- GPS visitor tracking
- Candlestick live chart
- Audience Overview
- Priority support
- FREE Popup Generator
- 10 domain installs
- Full real-time dashboard
- All analytics features
- GPS visitor tracking
- Candlestick live chart
- Audience Overview
- Priority support
- Resell to clients
- FREE Popup Generator
- 25 domain installs
Lifetime License: You pay once. No recurring charges, no subscription traps, no feature limits behind paywalls. Every plan includes all current and future features including GPS tracking, the candlestick chart, and Audience Overview.
Pricing rationale: Starter at $34 is priced for solo freelancers and personal projects. Agency at $74 gives agencies 10 client installs. Agency at $199 for 25 domains — install on every client website you manage, forever.
Stop Renting Your Data. Start Owning Your Intelligence.
Most analytics platforms hold your traffic data hostage behind monthly subscriptions that never end. NeonStat puts the power back on your own server. For the cost of just two months of a typical SaaS subscription, you get professional-grade visitor tracking and total data privacy for life. No trackers blocked by browsers, no third-party cookies, and zero monthly fees.
FREE Popup Generator ($25 Value): Purchase today and get our Smart Popup engine included at no cost. Use your visitor's real-time Lead Score to trigger high-conversion coupons or opt-ins only when a visitor hits "HOT" or "PRO" status. It's the ultimate weapon for turning traffic into profit.
Troubleshooting
Common issues and their solutions. Most problems are resolved in under two minutes.
| Problem | Likely Cause | Solution |
|---|---|---|
| Visitors not appearing | tracker.js not installed or wrong path | Verify the tracker script is in your website <head> tag. Check browser console for 404 errors. |
| Dashboard shows "Connecting" | Heartbeat AJAX blocked or sessions folder not writable | Set visitors/ folder permissions to 755. Check .htaccess is not blocking AJAX POST requests. |
| Live / Idle / Loading all show 0 | PHP check_notifications handler not calculating session states | Ensure index.php v1.0 is installed. The handler reads live/idle/loading from actual session files using a 30-second threshold for "live" classification. |
| GPS coordinates not showing | Visitor denied permission or site is on HTTP | GPS only works on HTTPS. Ensure SSL is installed. Visitor must grant browser location permission when prompted. |
| Candlestick chart shows flat data | Insufficient visitor traffic for OHLC variation | The chart needs multiple visitor count changes within a 5-minute window. Low-traffic sites may show minimal candle height until traffic grows. |
| License activation fails | cURL disabled or no internet on server | Ensure PHP cURL extension is enabled. Check your server can reach neonstat.com outbound. |
| All locations show "Global Access" | GeoIP API timeout or blocked on server | Allow outbound HTTP to ip-api.com. Check server firewall rules for outbound connections. |
| Forgot admin password | Password lost | Click "Forgot Password?" on the login screen. Enter your Master Recovery Key set during activation. |
| Charts not loading | JavaScript blocked or apexcharts.js missing | Confirm assets/js/apexcharts.js exists and is accessible. Check browser console for errors. |
Frequently Asked Questions
Release History
Major Update — GPS, Candlestick & Audience Overhaul
GPS for All Visitors: GPS tracking is no longer admin-only. tracker.js now requests geolocation permission from every visitor, capturing precise lat/lon coordinates and accuracy readings stored per session. Falls back gracefully to IP-based geolocation if denied.
Real Candlestick Data: Fixed the check_notifications PHP handler to calculate authentic Live, Idle, Loading, and Offline counts from actual session files. Live = active in last 30 seconds. Idle = 30s to 5min. Loading = page transitioning. Candle OHLC values now built from genuine visitor count samples.
Google Analytics-Style Audience Overview: Redesigned Audience Overview with a multi-series area chart (Users / New Users / Sessions), summary metric tiles (Avg Duration, Bounce Rate, Pages/Session), and all data sourced from real history logs.
License System Hardening
Download race condition fixed with PHP file locking. Domain enforcement added to verify and license validator. Domain release and license deletion features added to admin panel. PHPMailer integration for reliable license email delivery. Dynamic pricing management panel.
Initial Release
Full launch of NeonStat Visitor Intelligence. Includes real-time live tracking, Visitor Intelligence drawer, Lead Scoring Engine (COLD/WARM/HOT/PRO), Top 15 Countries panel, Geography Engine with 200+ country map, Bot and Suspicious visitor detection, IP Ban system, Sound Alert system with 12 tones, Dashboard theme customization, Analytics Report download, CSRF protection, Remote kill-switch license system, and WordPress Connector plugin.
Updates are delivered as new downloadable packages from NeonStat. Your license key provides access to all future updates within your plan tier at no additional cost.
Dashboard Gallery
Your NeonStat Website Visitor Intelligence purchase includes FREE Popup Generator. Hover over the rotating gallery to pause. Click any thumbnail below to preview a section of the dashboard.